By The New Stack -
2020-12-16
By The New Stack -
2020-12-16
In this article, we’re going to share which health metrics are most critical for Kubernetes operators to collect and analyze.
 By SpeedCurve -
2021-02-19
By SpeedCurve -
2021-02-19
If you're just getting started with performance budgets – or if you've been using them for a while and want to validate your work – this post is for you.
 By Neo4j Graph Database Platform -
2015-12-23
By Neo4j Graph Database Platform -
2015-12-23
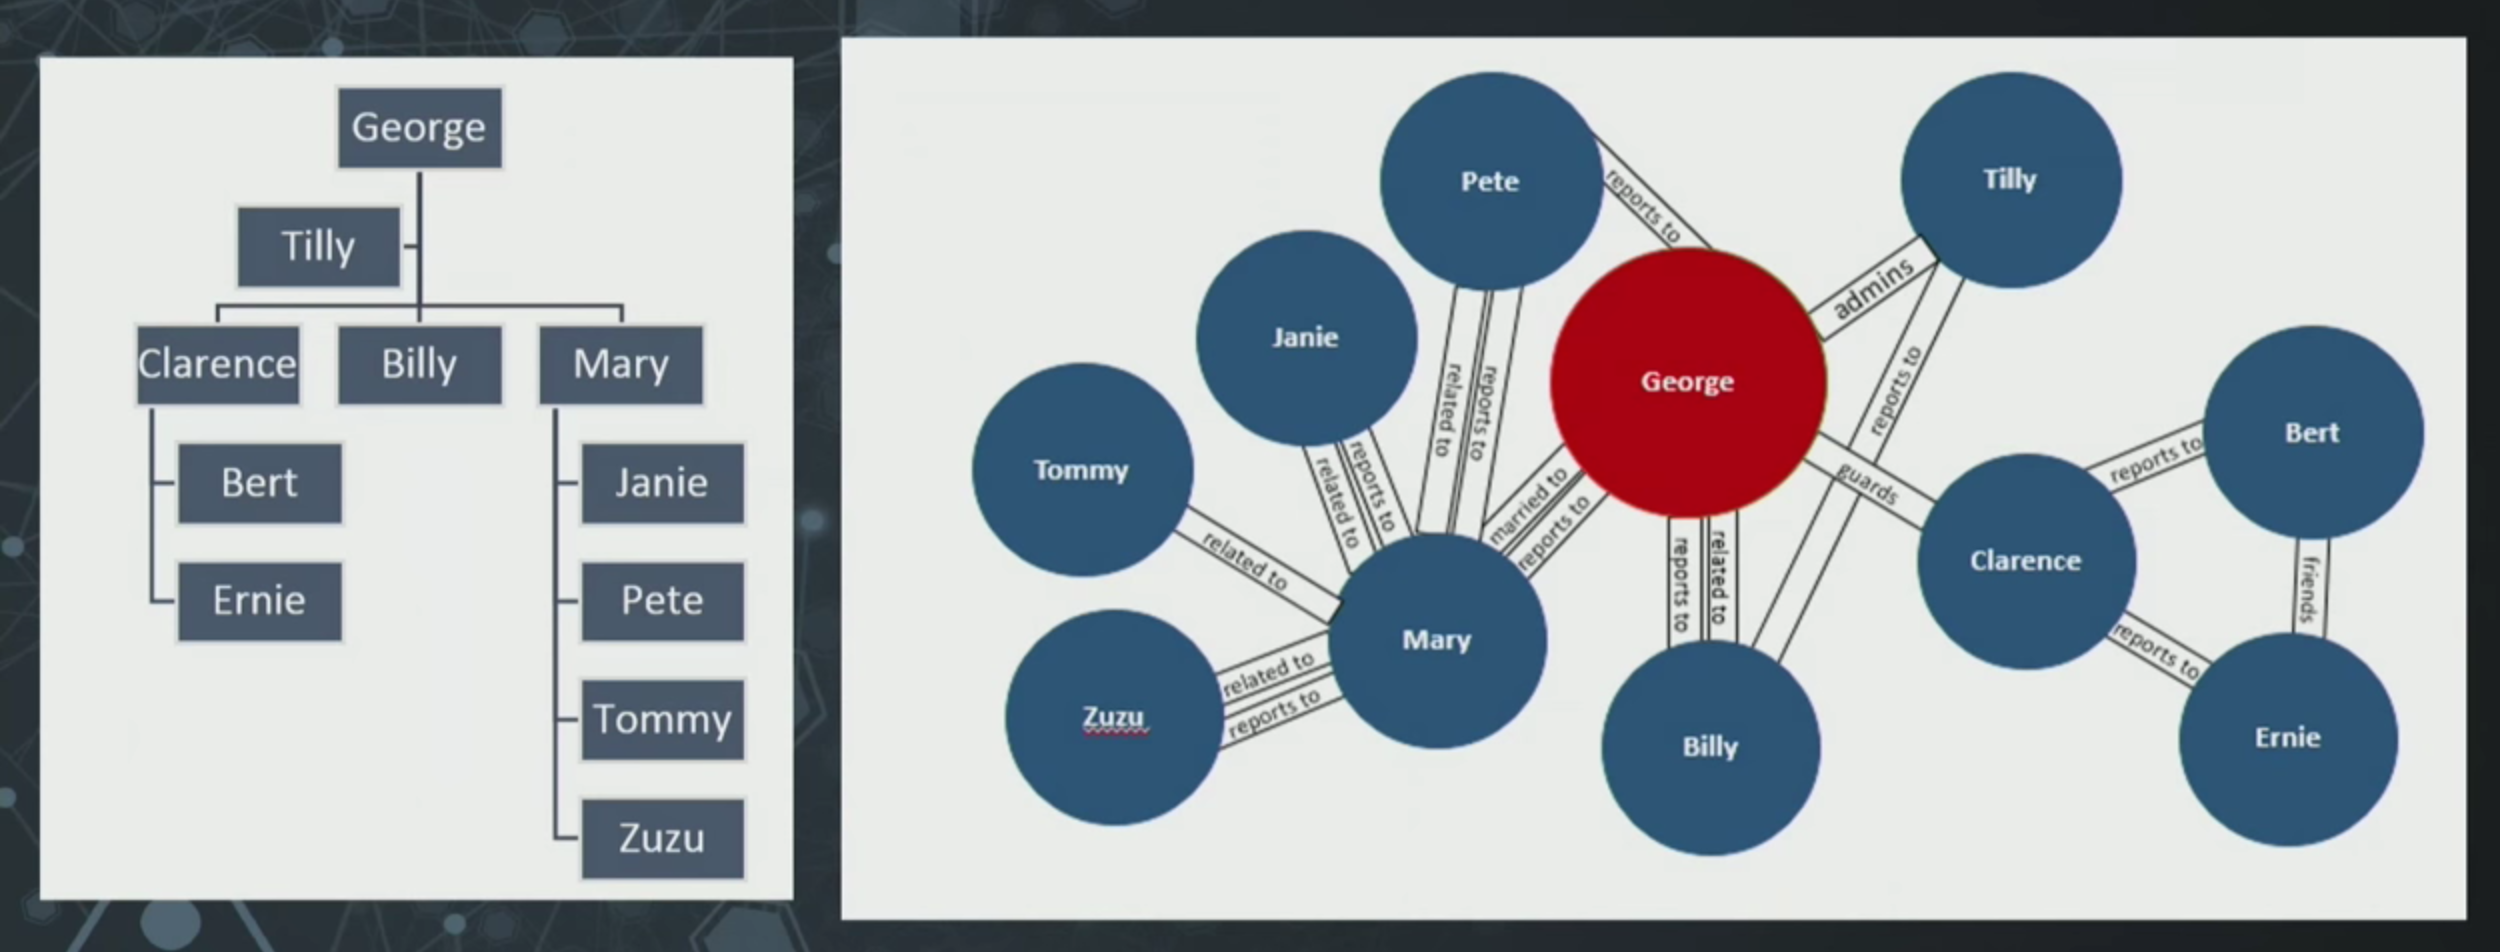
Watch (or read) Senior Project Manager Karen Lopez’s GraphConnect presentation on the signs that your data is actually a graph and needs a graph database.
 By Medium -
2021-03-22
By Medium -
2021-03-22
Google Data Studio is a tool I have been using more and more in the past few months. With the high usage, I have come to notice its advantages over other tools, its capabilities, but also its’…
 By Medium -
2020-12-14
By Medium -
2020-12-14
What is it, how does it help, tools used and an experiment
 By Docs -
2021-01-24
By Docs -
2021-01-24
Describes benefits, challenges, and best practices for Big Data architectures on Azure.