 By ryanfiller.com -
2020-12-11
I am a designer, developer, illustrator, and maker living and working in Memphis, Tennessee. This is my blog and portfolio.
 By Medium -
2021-02-05
In this article, we will first understand the blockchain and how mining works. Then we will understand how to do bitcoin mining in python.
 By realpython -
2021-02-02
In this tutorial, you'll learn what the stochastic gradient descent algorithm is, how it works, and how to implement it with Python and NumPy.
 By DEV Community -
2021-01-08
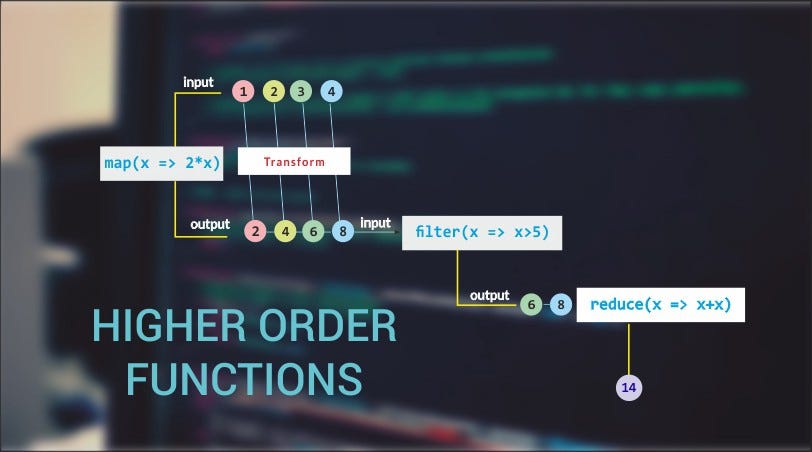
Arrow function is an alternative form of creating a function in JavaScript. It was introduced in ES6....
 By Medium -
2020-12-06
Everyone has their reasons for pursuing a career in programming no matter the language. Some learn it because they love it and it mimics they way they think anyways. Some do it for the money. Others…
 By PyImageSearch -
2021-02-08
In this tutorial, you will learn how to perform histogram matching using OpenCV and scikit-image.


