By Medium -
2021-01-15
By Medium -
2021-01-15
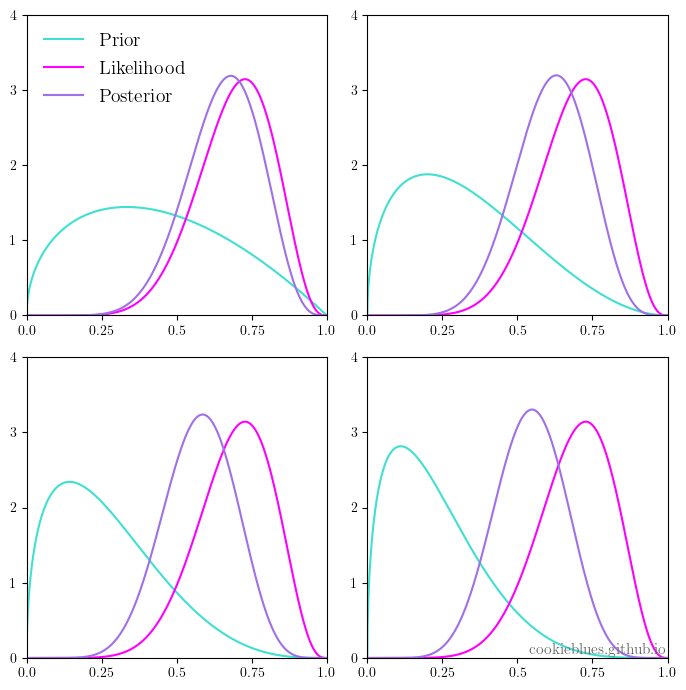
I recently came across the article “How HDBSCAN works” by Leland McInnes, and I was struck by the informative, accessible way he explained…
 By Medium -
2020-12-14
By Medium -
2020-12-14
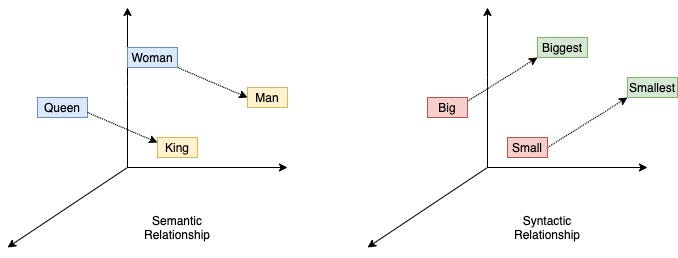
What is it, how does it help, tools used and an experiment
 By Medium -
2021-02-01
By Medium -
2021-02-01
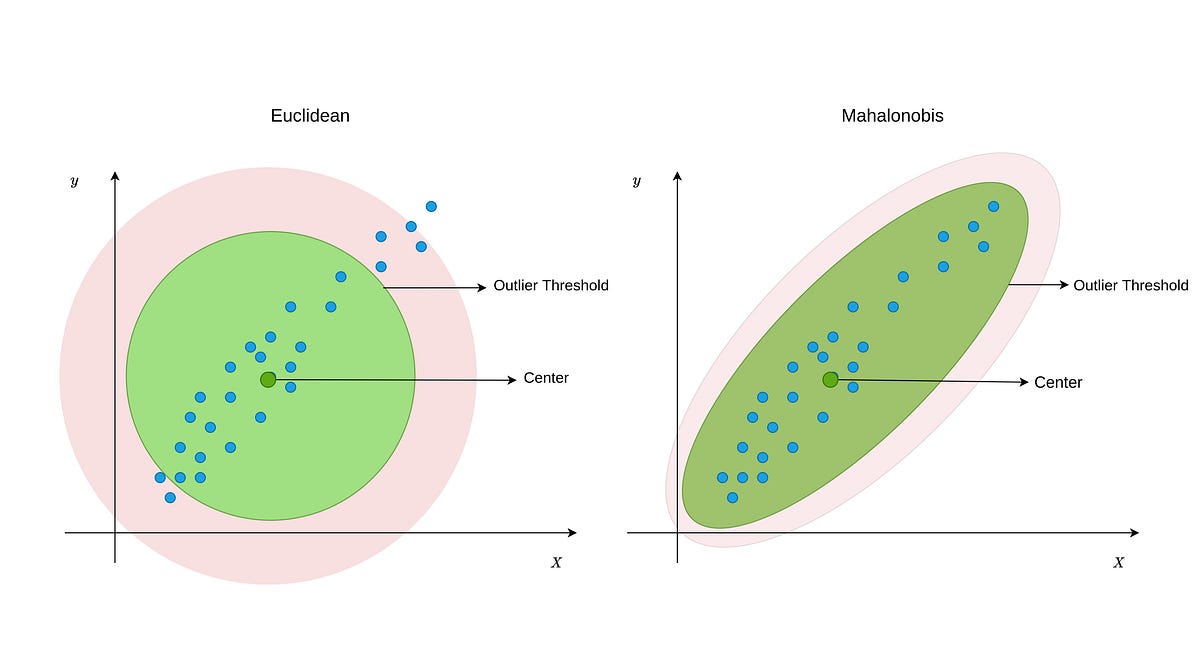
Exploring the advantages and pitfalls of 9 common distance measures used in Machine Learning applications.
 By Medium -
2021-02-04
By Medium -
2021-02-04
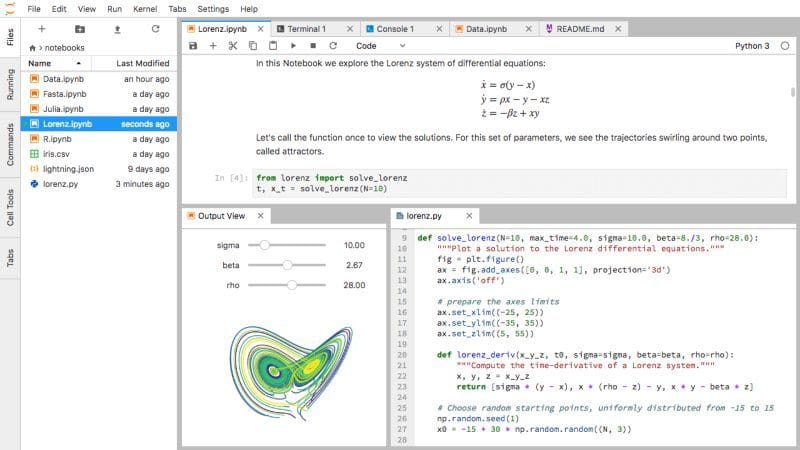
When we start learning how to build deep neural networks with Keras, the first method we use to input data is simply loading it into NumPy arrays. At some point, especially when working with images…
 By CMSWire.com -
2021-03-16
By CMSWire.com -
2021-03-16
Not all data is valuable or actionable and discerning which is which can be hard. Learn to craft a successful data strategy that can help a brand learn to swim.
 By Medium -
2021-03-07
By Medium -
2021-03-07
This is a tough metaphor for me to use as a proud cat parent, but the sentiment has never been more accurate when it comes to data in the 21st century. While it’s true that you can solve most of your…