 By R-bloggers -
2020-12-24
Linear Regression with R Chances are you had some prior exposure to machine learning and statistics. Basically, that's all linear regression is – a simple
 By KDnuggets -
2021-01-05
This post aims to make you get started with putting your trained machine learning models into production using Flask API.
 By Medium -
2021-01-31
Electricity demand forecasting is vital for any organization that operates and/or is impacted by the electricity market. Electricity storage technologies have not caught up to accommodate the current…
 By Medium -
2020-07-25
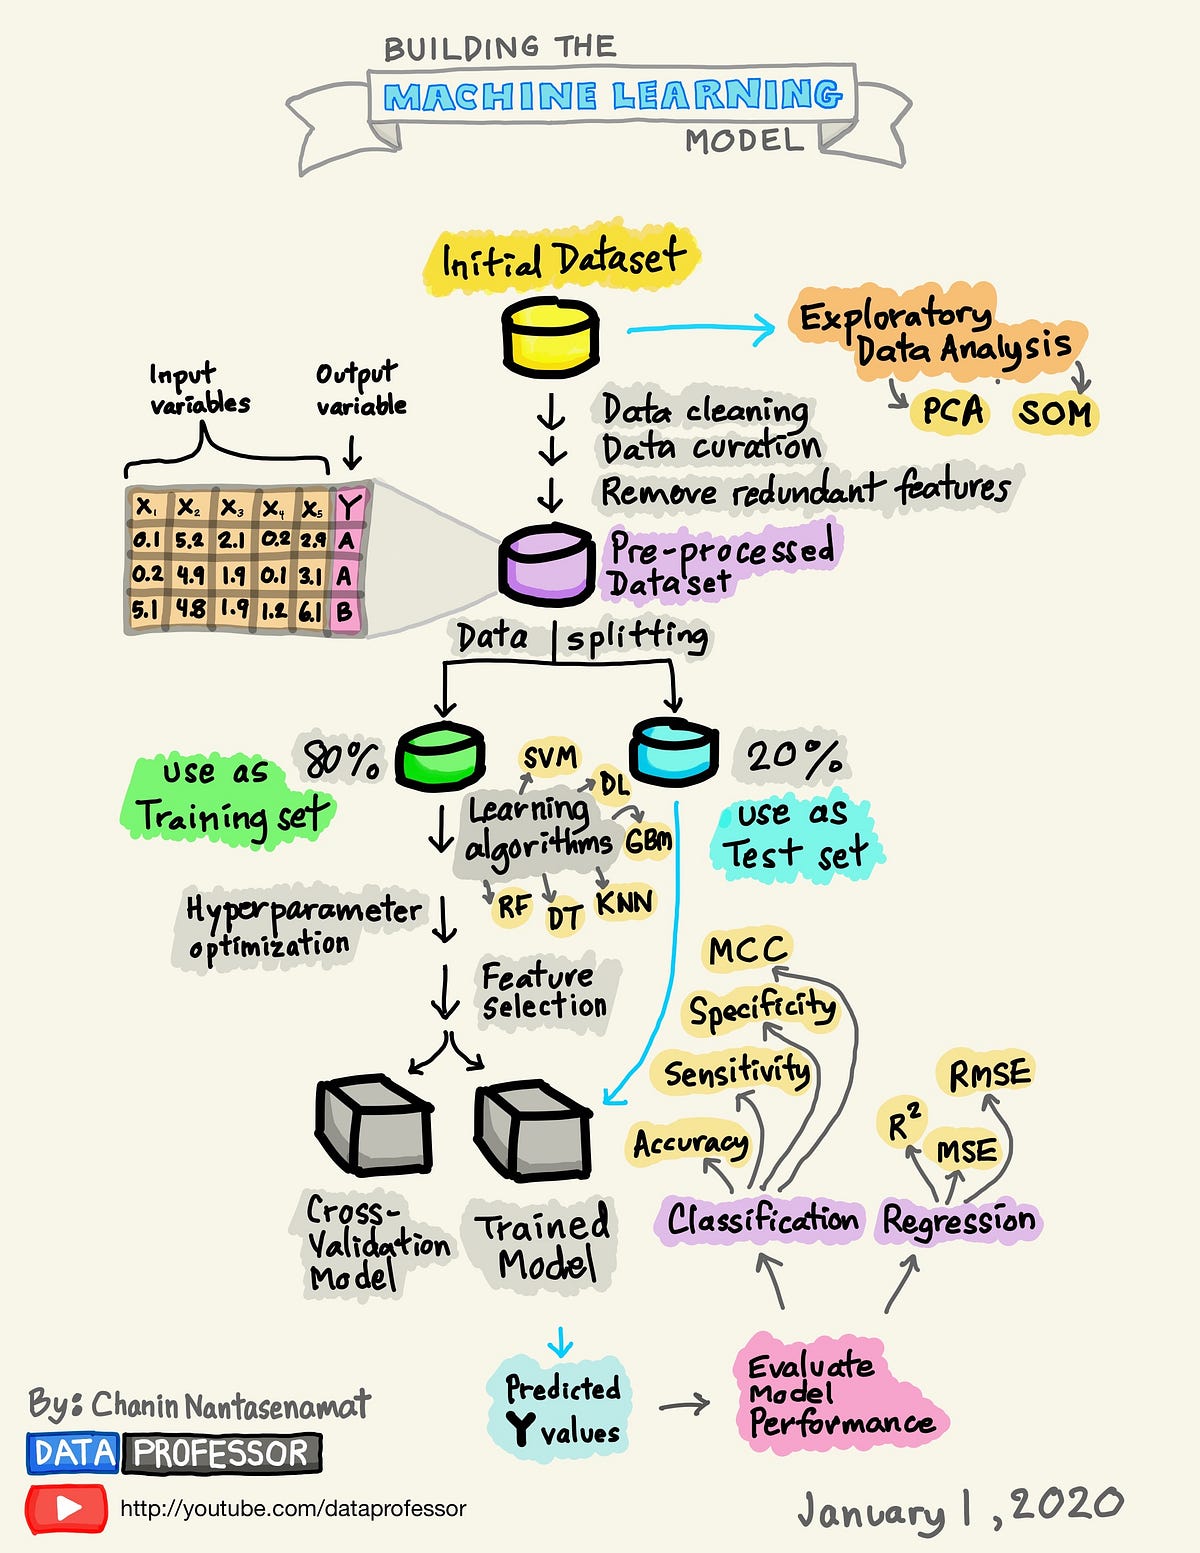
A Visual Guide to Learning Data Science
 By Medium -
2021-01-05
Demonstrating the efficiency of pmdarima’s auto_arima() function compared to implementing a traditional ARIMA model.
 By Medium -
2020-12-25
In my previous TDS article I described about the Machine Learning variant of Deep Hybrid Learning and how easily it can be applied for image data. If you are someone who is new to the concept of Deep…


