By realpython -
2021-02-25
By realpython -
2021-02-25
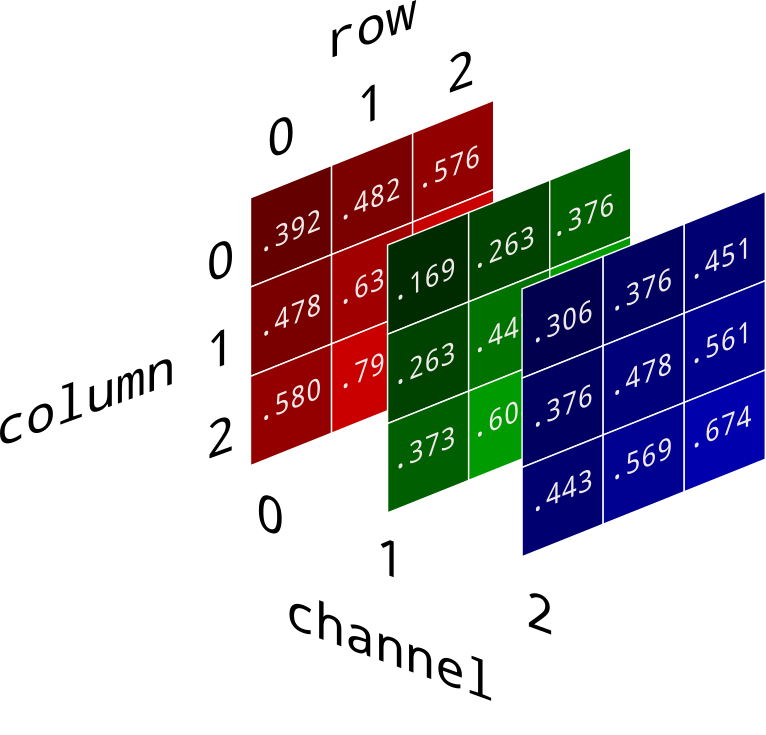
In this tutorial, you'll learn everything you need to know to get up and running with NumPy, Python's de facto standard for multidimensional data arrays. NumPy is the foundation for most data science ...
 By LogRocket Blog -
2021-01-26
By LogRocket Blog -
2021-01-26
Everything you need to know about getting started with unsafe Rust. Learn to troubleshoot common issues and debunk popular myths.
 By Medium -
2021-01-31
By Medium -
2021-01-31
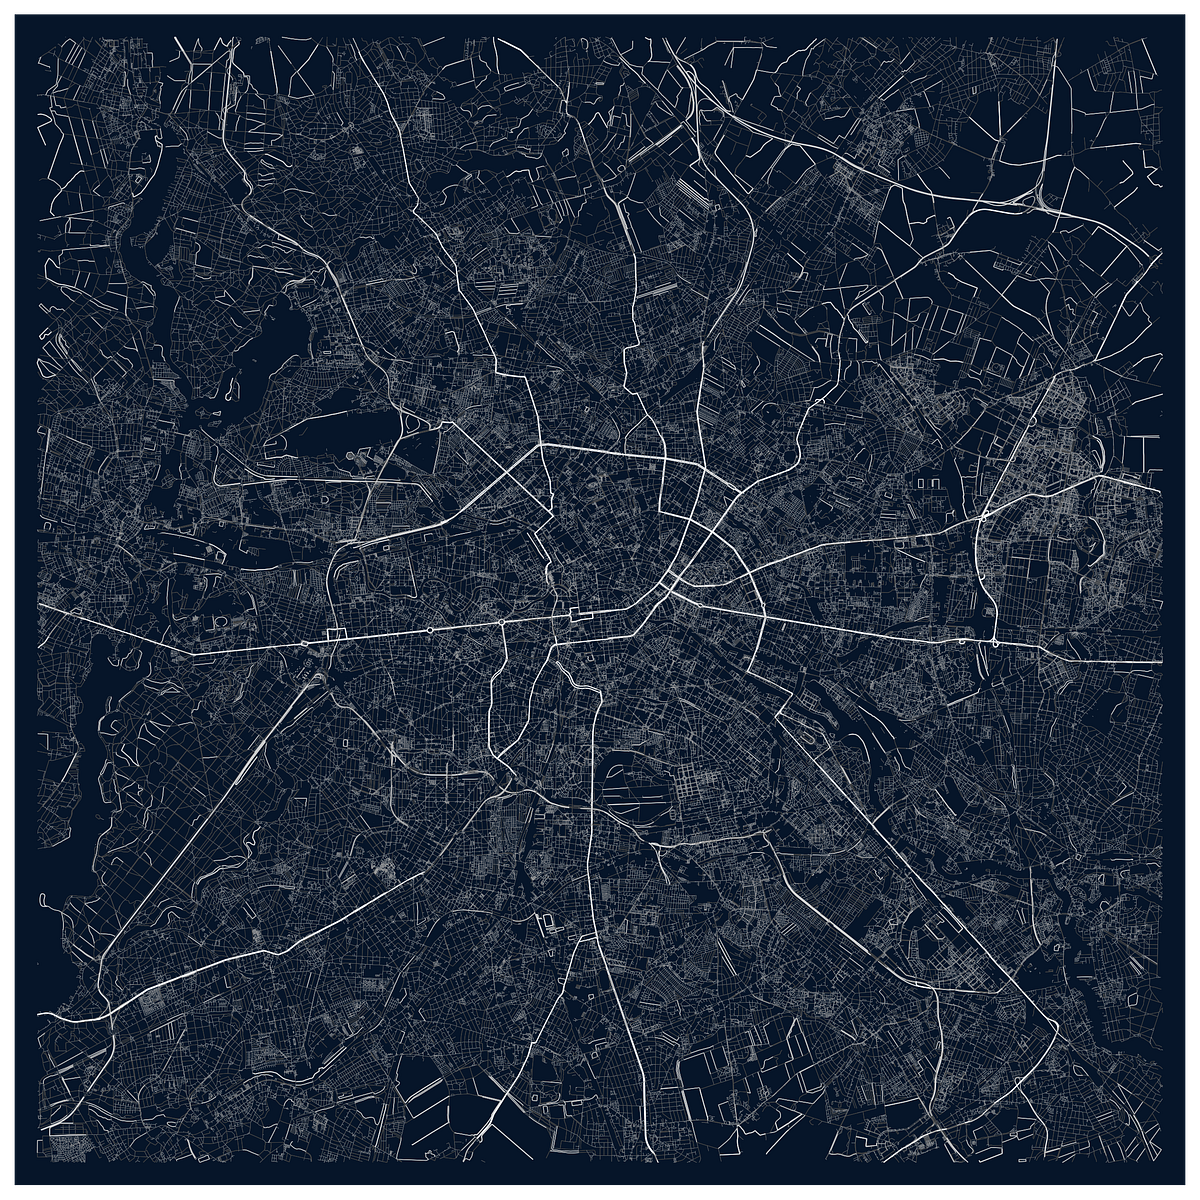
I always liked city maps and a few weeks ago I decided to build my own artistic versions of it. After googling a little bit I discovered this incredible tutorial written by Frank Ceballos. It is a…
 By DataCamp Community -
2021-02-05
By DataCamp Community -
2021-02-05
PYTHON for FINANCE introduces you to ALGORITHMIC TRADING, time-series data, and other common financial analyses!
 By Medium -
2020-12-04
By Medium -
2020-12-04
Showing the future to business managers: A step-by-step to create a time series prediction of your web traffic plotted as a GIF.
 By R-bloggers -
2019-05-22
By R-bloggers -
2019-05-22
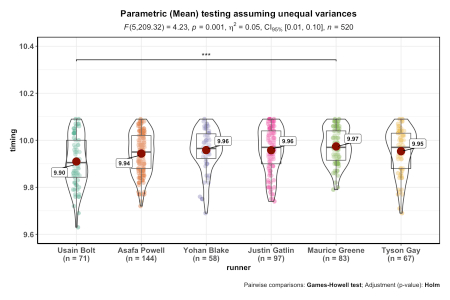
So, a programmer, a frequentist, and a bayesian walk into a bar. No this post isn’t really on the path to some politically incorrect ste ...